Using Behavioral Analytics to Optimize the User Experience
If you don’t understand your audience, how can you possibly market to them successfully?
Clicks, scrolls, bounces — each action is a clue to unravel. And when you gather enough data on how people interact with your site, patterns start to emerge. That’s why digging into behavioral analytics is crucial to optimizing the user experience.
Traditional web analytics tools throw numbers at us, but what do they mean? How do we translate data into decisions? How can we use that data to close the gap between information and action?
That’s the key to creating strategies built on insight rather than guesswork. In this post, we’ll dive into the world of behavioral analytics. Keep reading to learn how to unravel the threads of user interactions, so you can transform raw data into actionable insights.
What is Behavioral Analytics?
Behavioral analytics examines user interactions on digital platforms. It involves collecting and analyzing data on how users engage with your digital platforms—what they click on, how far they scroll, what grabs their attention, and what they ignore. This data is then transformed into actionable insights, enabling you to optimize user experience, enhance engagement, and boost conversion rates.
Behavioral analytics goes beyond just tracking clicks and scrolls. It helps us understand the reasons behind user actions. Unlike traditional tools like Google Analytics, which focus on numbers, behavioral intelligence reveals the user experience’s depth—identifying frustration, engagement, and satisfaction levels. This insight allows us to develop targeted strategies that connect emotionally and logically with users, influencing their decisions more effectively.
To leverage behavioral analytics is to move beyond simple statistics. The goal is understanding the full story behind the audience’s journey. That’s the difference between knowing a page has high traffic and understanding why. This is crucial for optimizing user experiences, enhancing engagement, overcoming sensory adaptation, and boosting conversion rates.
Types of Behavioral Analytics
Behavioral analytics uses many tools and techniques — each provides a unique lens through which we view user behavior. Let’s take a look at various types of behavioral analytics to uncover how they bring the story of user interaction to life.
Heatmapping

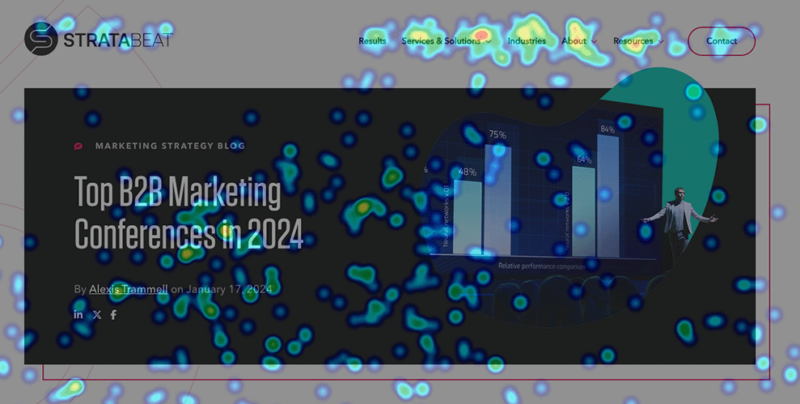
Heatmapping is a website x-ray. It reveals hotspots where user activity burns brightest. This visual tool uses color-coded dots and splotches. These show where users click, touch, and spend time on a page. The warmer the color, the higher the concentration of interactions.
Heatmaps unlock insights into user preferences and behavior. By analyzing these colorful overlays, you can see what draws interest and where users get frustrated. This knowledge can help you optimize page layouts and refine content placement. It can also help you make sure that crucial calls to action (CTAs) are visible and compelling.
Clickmapping
Clickmapping provides a simple view of user behavior. It does this by tracking every tap and click on a website. It’s a type of heatmapping that shows where users interact. Each click is a vote of interest or a search for more. Knowing where users click indicates what catches the eye and prompts action.
Pairing heatmaps with scroll and click mapping offers a complete picture of user engagement. These tools show where users click and how much of the content they explore. Scroll mapping, for instance, can show us if our homepage effectively directs visitors to key content. Similarly, click mapping can reveal whether our calls to action are catching the users’ attention, helping us make necessary adjustments for better engagement.
Clickmaps help you understand which elements of a webpage perform as intended. Are users clicking where you expect them to? Are there areas receiving unexpected attention? This could indicate optimization or redesign potential. Incorporating clickmapping into your analytics can impact your conversion funnel. You can simplify the customer journey by finding and highlighting the best parts.
Clickmapping also highlights mismatches between user expectations and website design. For instance, non-clickable elements that users try to interact with. Be sure to address these discrepancies to reduce user frustration and enhance usability.
Attention Mapping
Attention mapping reveals not only where users click, but where they linger. This offers a window into what targeted messaging genuinely captivates your target audience.
Unlike heatmaps that show hotspots and clicks, attention maps highlight prolonged focus. Is the compelling headline, vibrant image, or insightful content keeping them on the page? Knowing guides your content strategy to align with these user interests. This improves the user experience and boosts retention — and visitors are more likely to return to a site that resonates with their interests and needs.
For example, in a B2B ecommerce store, users might linger on specific products. However, if they’re not following through with purchases, there’s a problem. The online store’s marketing department can then try to pinpoint what’s stopping customers. Is it the price point? The CTA? Is it unclear where to click to add items to their cart?
Attention mapping can also provide unexpected insights, like consistently overlooked content sections. These discoveries provide opportunities to rethink and reorganize.
Scroll Mapping
Scroll mapping highlights how far users are willing to scroll on your website. This tool displays the depth of user engagement down a page. It shows where interest wanes and what content might go unseen.
The “fold” — the point at which users must scroll to see more content — is important for websites. Scroll maps reveal whether key information above the fold encourages exploration. This knowledge is crucial for content strategists. It helps them optimize page layouts for maximum impact.
Video Recordings and Mouse Movements
Video recordings and mouse movements show a full replay of user sessions. It goes beyond static maps and charts. You get a real-time glimpse into the user’s journey. With this tool, you capture every click, scroll, and hover in action.
Imagine sitting beside your users, watching as they navigate your site. Video recordings allow you to virtually do just that. This unveils the nuances of the digital experience. It highlights areas of friction and opportunities for enhancement.
Mouse movement tracking, in particular, can show user intent and interest. The way users move their cursor shows where they’re looking and what they’re reading. Fast mouse movements and erratic clicking can show confusion or frustration. If you see this occurring regularly, it’s time to review website design and content clarity.
Analyzing video recordings and mouse movements gives us direct insight into how users interact with our site. This allows us to spot exactly where users face confusion or lose interest. By understanding their journey, we can refine our site to smooth out these rough patches, making sure every part of the site is engaging and easy to navigate.
Funnel Analysis
Funnel analysis is the strategic dissection of a website’s conversion paths. It pinpoints where users drop off and why. A funnel analysis maps out the user journey from the initial visit to the final action. That final action could be purchasing, signing up for a newsletter, or completing a form. Examining each step in your funnel allows you to find bottlenecks that slow conversions.
But funnel analysis isn’t just about fixing leaks. It’s about understanding the customer journey in its entirety. Analyzing how different demographic segments navigate your site lets you tailor experiences for their specific interests and behaviors. This segmentation makes sure that marketing efforts are not one-size-fits-all. They’re carefully crafted to appeal to a diverse audience with different needs.
User Feedback
User feedback is a direct line to your audience’s thoughts and experiences. It complements the behavioral data collected through analytics tools and can help you connect the dots. This involves actively asking users about their interactions with your website or product. Users can then share their likes, frustrations, and desires for improvement through surveys, feedback forms, or polls.
Incorporating user feedback into your analytics strategy brings a human element to the data. While heatmaps and clickmaps show what users do, feedback tells you why they do it.
For example, if funnel analysis indicates a high drop-off rate at a particular step, user feedback can show you why. Engaging users for feedback also creates a sense of community and shows them you value their input. This can significantly boost customer loyalty and retention.
Utilizing behavioral triggers and making our calls to action contextually relevant significantly boosts marketing effectiveness. By responding to users’ digital body language, we can offer content and deals that match their level of interest, dramatically increasing our conversion rates. This strategy combines timely, relevant messaging with a deep understanding of user behavior for maximum impact.
Dorothea Gam, CMO at Mouseflow states, “With behavioral analytics, we move beyond guesswork and gain concrete insights into how users interact with our websites. As much as I love Google Analytics, it only tells part of the story. It’s not just about the final numbers; it’s about decoding the story behind those numbers, revealing user behavior, motivations, and experiences. This is where behavioral analytics truly shines.”
With behavioral analytics, we move beyond guesswork and gain concrete insights into how users interact with our websites.
Traditional Web Analytics vs. Behavioral Analytics
Traditional web analytics often feels like looking at the world through a keyhole — it offers basic insights like page views, session lengths, and bounce rates. While helpful, this data tells you what is happening on your site but leaves you guessing why users behave the way they do.
Enter behavioral analytics, which zooms out for a panoramic view, revealing not just what users do, but diving deep into how and why they interact with your site the way they do. Here’s why it’s a game-changer:
- User Journey Mapping: Traditional analytics might tell you that a visitor landed on a page and left, but behavioral analytics shows the full story — the path they took, where they lingered, and what they ignored.
- In-Depth Interaction Insights: While traditional tools give you numbers, behavioral analytics offers context. It tells you why users abandon carts or which content keeps them engaged, turning data into a rich narrative.
- Personalization at Scale: Traditional analytics can segment users into broad categories. Behavioral analytics, however, allows for micro-segmentation based on actual interactions, enabling hyper-personalized experiences that resonate deeply with each visitor.
- Proactive Problem Solving: With traditional analytics, you react to trends. Behavioral analytics equips you to anticipate user needs and address obstacles before they become conversion barriers.
- Enhanced User Experience: Traditional analytics might indicate a drop in page views, but behavioral analytics uncovers why, providing actionable insights to improve design, content, and usability for a superior user experience.
Benefits of Behavioral Analytics

Uncover Visitor Interests and Oversights
Pinpoint exactly what draws your audience in. Position essential content and CTAs strategically across your site to maximize visibility and impact. Behavioral analytics enables you to capture interest and maintain it, trimming away anything that doesn’t serve your audience’s needs or your business goals.
Strengthen Your Funnels
Deep dive into where and why potential customers are dropping off. Understanding these critical junctures allows for targeted interventions to keep users engaged and moving smoothly toward conversion, significantly reducing drop-off rates.
Harness Real-Time Feedback for Agile Adjustments
In-the-moment feedback is a goldmine. It aligns your offerings more closely with what your customers actually want and need. This real-time insight enables you to quickly adapt, refining your services or products to better meet user expectations and market demands.
Cultivate Emotional Connections Through First-Party Data
Beyond the numbers, behavioral analytics helps forge deeper emotional connections with your audience. Insights into the emotional drivers behind user decisions enable you to craft experiences and content that resonate on a more personal level, strengthening loyalty and enhancing user satisfaction.
Drive Data-Driven Website Improvements
Empower your website updates with actionable insights, not assumptions. Behavioral analytics equips you with a solid foundation of data to inform your decisions, ensuring every change you make is targeted and effective. This commitment to data-driven updates fosters a culture of continuous improvement and strategic innovation.
Define Your Audience Segments and Personas First
The initial step toward leveraging behavioral analytics is to defining your audience segments. This foundational task is key to understanding the complex buying behaviors and the various decision-makers involved.
By segmenting your audience, you can tailor your analysis to distinct groups, considering demographics, behaviors, and other criteria. Creating personas goes a step further, allowing you to deeply connect with your users by outlining a comprehensive profile of your ideal customer, including their needs, objectives, and challenges.
Take, for example, a SaaS company that might segment its audience into small businesses, mid-sized companies, and large enterprises. This segmentation acknowledges that each group has unique needs and interacts with technology differently, enabling more targeted and effective strategies.
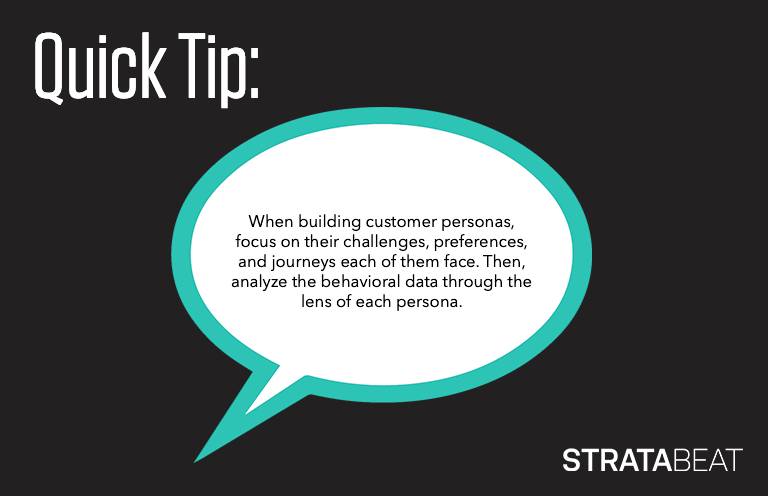
The next step involves creating customer personas, which are detailed profiles of ideal customers, highlighting their challenges, preferences, and behaviors. For instance, a persona like “Tech-savvy Terry” could represent IT managers in mid-sized companies, detailing their daily hurdles and objectives and their solution-seeking behavior.
Consider a cloud-based project management software firm aiming to enhance user engagement. By identifying key customer segments—startups, mid-sized agencies, and large corporations—personas are developed to encapsulate the specific needs and behaviors of each group. For example, “Startup Steve” epitomizes an agile founder seeking scalable solutions, while “Corporate Carla” portrays a CTO in search of robust, integrable features.
Analyzing behavioral data through these personas reveals distinct usage patterns. Startups, represented by “Steve,” may favor collaboration tools but neglect advanced reporting, a feature valuable to “Carla’s” large corporations. This understanding enables the creation of targeted tutorials and feature highlights, significantly boosting user engagement and feature adoption across various segments.
Need help overcoming sensory adaptation, cutting through the clutter, and reaching your audience?
Build a marketing campaign that is not just successful but legendary. Book a Strategy CallThe Importance of Configuring Filters in Behavioral Analytics
Google Analytics Only Tells You Half the Story
When it comes to increasing conversion rates, Behavioral Analytics can provide indisputable evidence of what’s keeping your users from converting.
Top Behavioral Analytics Tools
Choosing the right behavior analytics tools can greatly boost your B2B insights. These tools capture intricate user interactions and translate them into actionable intelligence.
Mouseflow
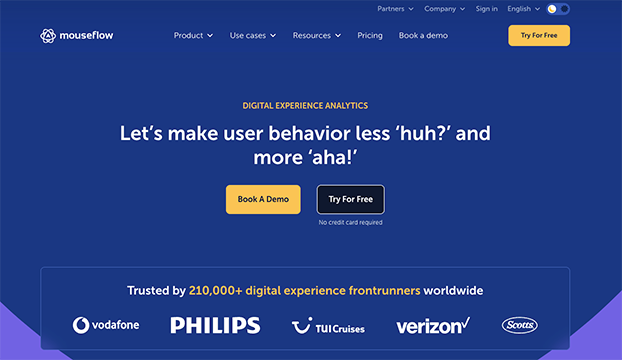
Tailor-made for businesses of any size, Mouseflow shines in e-commerce with its heatmaps, session replays, and analytics on funnels and forms, making it indispensable for analyzing online shopping behaviors and optimizing checkout flows.
VWO
A suite loaded with A/B testing, heatmaps, and more, VWO is the go-to for businesses ready to refine their websites with precise, data-driven tweaks. It’s the architect behind creating compelling, optimized online spaces.
Fullstory
With its detailed session replays and user journey insights, Fullstory is a beacon for SaaS and complex sites aiming to polish the user experience to perfection, revealing the intricacies of every click and scroll.
Hotjar
Offering an intuitive path to understanding user behavior through heatmaps and recordings, Hotjar is the gateway for startups and small businesses to embark on their analytics journey without the steep learning curve.
ContentSquare
For those seeking deep dives into web and app usability, Contentsquare provides advanced analytics that uncover how users interact with every element, serving large enterprises and e-commerce giants.
Smartlook
Focused on qualitative data, Smartlook offers session replays and heatmaps that bring clarity to user engagement for websites and mobile apps, perfect for developers and SMBs eager to enhance the user interface.